
How to Load Test Your Backend with JMeter
What Is Load Testing?
I’ve written before about how software testing is just collecting information about the quality of your application. Load testing is the same idea, narrowed to one specific question: how does your software behave under load?
That information matters because performance problems are business problems. A slow checkout flow loses sales. A site that goes down during a product launch damages your reputation. An app that crawls under heavy traffic drives users to your competitor. Load testing is how you find those risks before your users do.
You Can Start With a Stopwatch
You can do performance testing manually. Open your app, start a stopwatch, click through a flow, stop the timer. That’s a performance test. Crude, but it’s collecting real information.
Google Chrome’s DevTools does this more accurately. Open your site, hit F12, go to the Lighthouse tab, and run an audit. You’ll get page load times, time to first byte, and a handful of other metrics — all without writing a single line of code or installing anything.
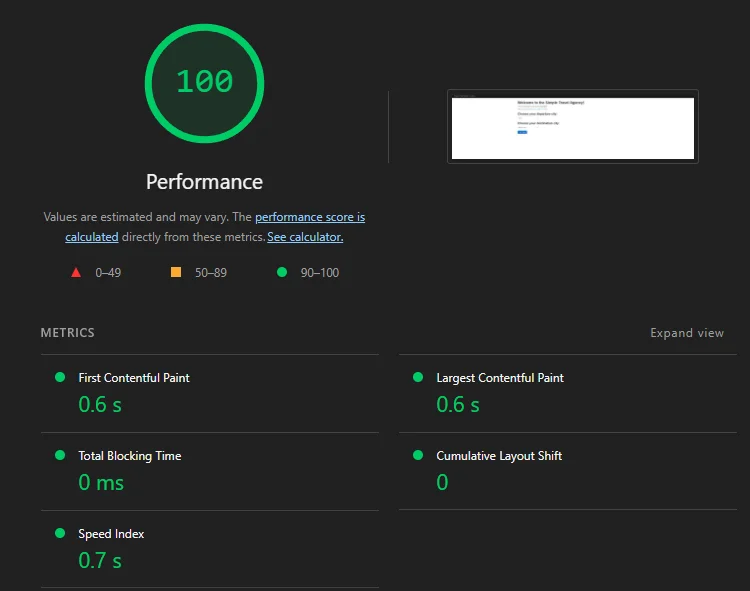
This is fine for a quick gut check. But it has two big limitations. First, it only measures your experience — one user, one moment in time. Second, it tells you nothing about how your application behaves when hundreds or thousands of users hit it simultaneously. That’s a completely different question.
Why You Need a Load Testing Tool
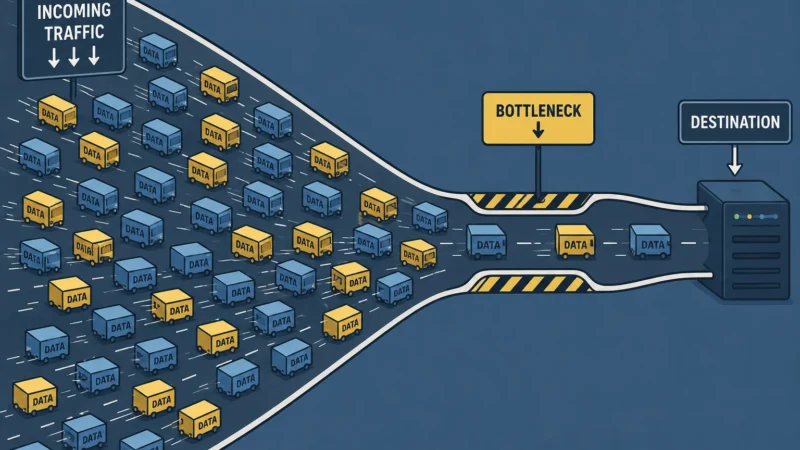
When a university opens course enrollment and thousands of students rush to purchase at the same time, the question isn’t whether the checkout page loads for one person. It’s whether the backend services can handle thousands of simultaneous requests without slowing to a crawl or falling over entirely.
That’s what a load testing tool does. It lets you simulate that volume of users, control how they ramp up over time, run them through a realistic flow, and collect performance data across the entire test — not just a single snapshot.
The metrics we care about are:
- Response time — how long each request takes. We’ll look at the average, median, and 90th/95th percentile. The percentiles matter more than the average — a single slow request can skew your average and hide the real picture.
- Error rate — what percentage of requests failed. Even a 1% error rate at high volume is a lot of unhappy users.
- Throughput — how many requests per second the server is actually handling. This tells you how much load your system can sustain.
- Active threads over time — how your simulated users ramp up during the test, so you can correlate spikes in response time with increases in load.
Together these tell you whether your application can handle the traffic you’re expecting — and where it starts to break down if it can’t.
Before You Start — A Word of Warning
Before we open any tools, this needs to be said: never load test a site you don’t own or don’t have explicit permission to test.
Load testing works by bombarding a server with thousands of simulated requests. To the server, that looks exactly like a denial of service attack. You can take down someone’s site, trigger security alerts, and depending on where you live, put yourself in legal trouble — even if you didn’t mean any harm.
Always get written permission before load testing any application you don’t own. If you’re doing this at work, make sure the right people know the test is happening and when. Production environments especially — coordinate with your team so nobody panics when the graphs spike.
For this tutorial we’re going to practice on blazedemo.com — a site built by BlazeMeter specifically for load testing practice. It simulates a flight booking flow and it’s realistic enough to be useful. While it’s designed for load testing, please be responsible with the load you generate. The same rules apply — don’t abuse it.
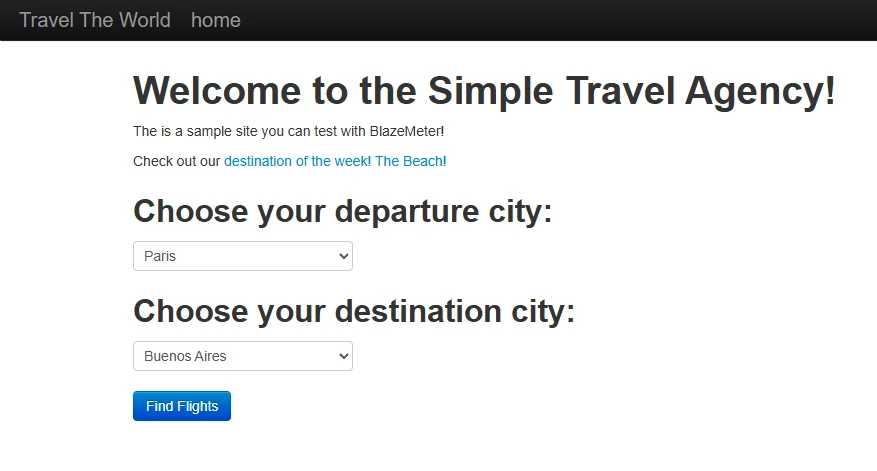
Go ahead and click through the flow manually first. Select a departure city, select a destination, browse the flights, pick one. Get familiar with what a real user would do — because that’s exactly what we’re going to simulate.
Installing JMeter
JMeter is free and open source. Here’s how to get it running on Windows.
Step 1 — Install Java
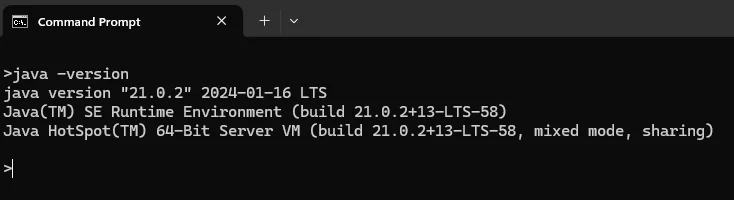
JMeter runs on Java, so you need it installed first. Check if you already have it by opening Command Prompt and typing:
java -version
If you get a version number back, you’re good. If not, download and install the latest Java JDK from adoptium.net — it’s free. Run the installer and follow the defaults.
Step 2 — Download JMeter
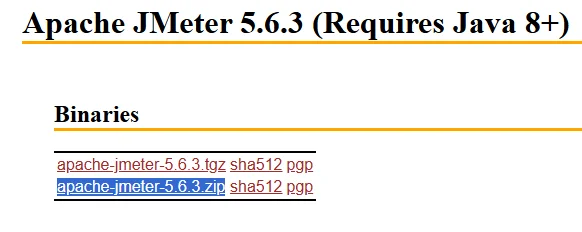
Go to jmeter.apache.org, click Downloads, and grab the latest binary zip file — it’ll be named something like apache-jmeter-5.x.zip.
Step 3 — Extract and Run
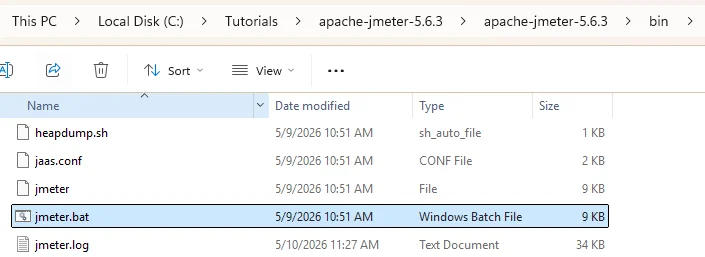
Unzip the file somewhere easy to find — your Desktop or C drive works fine. Open the unzipped folder, navigate to the bin folder, and double click jmeter.bat to launch it.
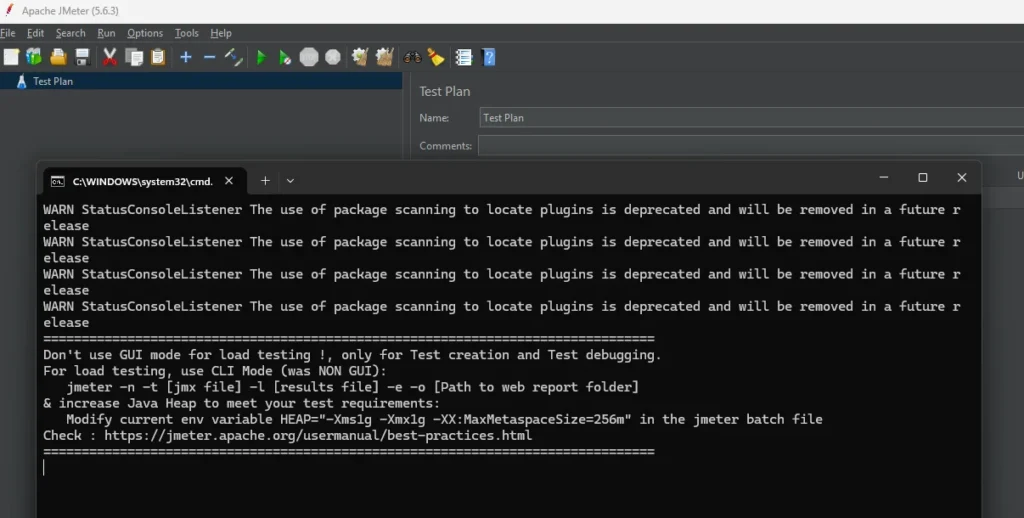
JMeter will open. It’s not the prettiest interface but you’ll get used to it.
Mac users — the process is the same except you launch JMeter by running jmeter.sh from the bin folder in your terminal instead of double clicking the .bat file. Java installation is also slightly different — you can use Homebrew: brew install --cask temurin.
Recording Your First Test with the BlazeMeter Recorder
Instead of building a test from scratch, we’re going to record a real user flow and let the tool generate the test for us. This is how I did it on the ed-tech project and it saves a lot of time.
We’ll use the BlazeMeter Chrome extension as our recorder. JMeter has its own built-in recorder but it has quirks and can miss requests. BlazeMeter’s recorder is cleaner and more reliable.
Step 1 — Install the BlazeMeter Chrome Extension
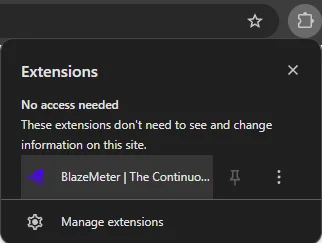
Go to the Chrome Web Store and search for “BlazeMeter” or find it directly by searching “BlazeMeter The Continuous Testing Platform.” Click Add to Chrome and install it. You’ll see the BlazeMeter icon appear in your Chrome toolbar.
You’ll need to create a free BlazeMeter account if you don’t have one. Sign up at blazemeter.com — the free tier is enough for recording.
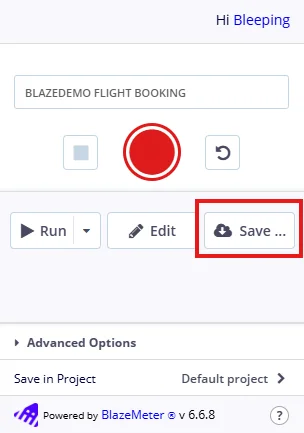
Step 2 — Name Your Test
Click the BlazeMeter icon in your toolbar to open the recorder. Before hitting record, give your test a name — something like “BlazeDemo Flight Booking.”
Step 3 — Configure Advanced Settings
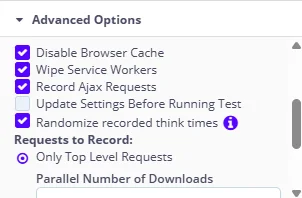
Scroll down to the Advanced Options section before hitting record. These are the settings I use for load testing:
- User Agent — set to Current Browser. Fine for most web apps.
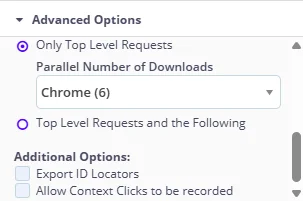
- Requests to Record — select Only Top Level Requests.
- Disable Browser Cache — check this. You want each simulated user hitting the server fresh, not serving assets from cache. Cache makes performance look better than it really is.
- Wipe Service Workers — check this. Service workers can intercept requests and serve cached responses, which would skew your results. Wiping them ensures every request goes all the way to the server.
- Record Ajax Requests — check this. Ajax calls are often where the real backend work happens. Missing these means missing key API calls.
- Randomize Recorded Think Times — check this. This makes simulated users behave more like real users with natural pauses between actions, rather than hammering requests back to back with zero delay.
- Export ID Locators — uncheck this. That’s a Selenium functional testing setting, not relevant for load testing.
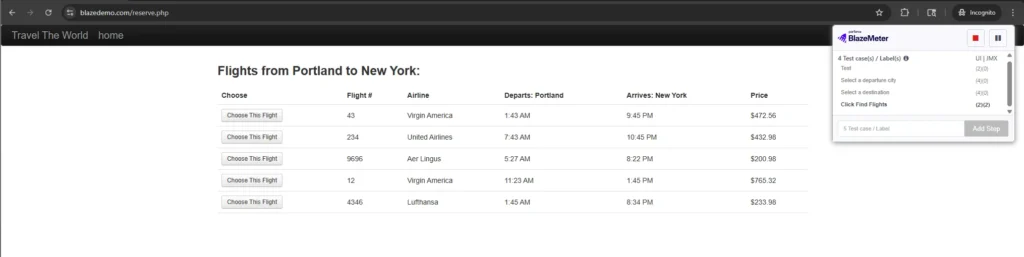
Step 4 — Record the Flow
Hit the red record button. Now go to blazedemo.com and walk through the flow like a real user would:
- Select a departure city
- Select a destination
- Click Find Flights
- Pick a flight
- Fill in the passenger details form
- Click Purchase Flight
Make sure you are naming every major step BEFORE you are performing the step. Since every click usually triggers a set of requests, you want to be able to clearly distinguish which requests were made for which step. I have messed this up many times where I do the step before naming it and it gets confusing when I check the requests in JMeter. But there are ways to fix this by either re-recording again, or manually figuring out which requests belong to which step by comparing the network panel requests with what your script recorded.
Once you’ve completed the purchase, go back to the BlazeMeter recorder and hit Stop.
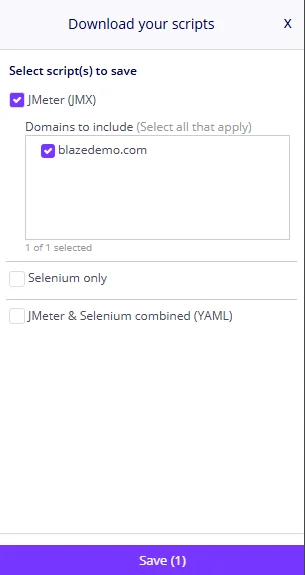
If you want to see the list of all the requests that were captured during your flow before saving, then click Edit. Otherwise, just click Save to open the Download Your Scripts screen to begin the export.
Step 5 — Export the JMX File
Select the JMeter (JMX) option, select the domains you want to include — I usually only pick my application’s domain and any third party services like Stripe that are needed to complete the flow — then click Save.
A quick note on what was just recorded
When you walked through that flow, BlazeMeter wasn’t just capturing page loads. It was capturing every API call your browser made to blazedemo.com’s backend — every request sent to the server behind the scenes. That’s what we’re going to replay at scale. We’re only going to focus on the backend traffic.
Don’t trust the recorder blindly
One thing I learned the hard way: BlazeMeter doesn’t always catch everything. Payment calls to third party services like Stripe were sometimes missing entirely from my recordings. You’d never know unless you checked.
So before you move on, do this extra step — it’ll save you from incomplete tests later.
Open blazedemo.com again, open Chrome DevTools (F12), and go to the Network tab. Filter it to XHR or Fetch requests so you’re only seeing API calls, not images and stylesheets. If you don’t see any requests, then just filter by All. Now walk through the same flow again manually.
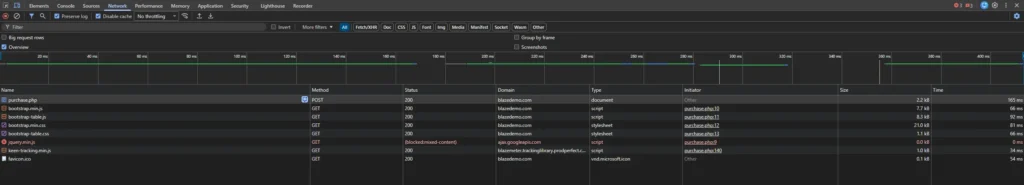
For each step in the flow, compare what shows up in the Network panel against what BlazeMeter recorded. The Network panel is your source of truth. If a request is there but not in your BlazeMeter recording, you’ll need to add it manually in JMeter.
The simplest way is to right click your Thread Group → Add → Sampler → HTTP Request, and fill in the method, path, and any parameters you saw in the Network panel. It’s tedious but straightforward.
Opening and Configuring Your Test in JMeter
Now that you have your JMX file, let’s open it in JMeter and configure it to run a realistic load test.
Step 1 — Open the JMX File
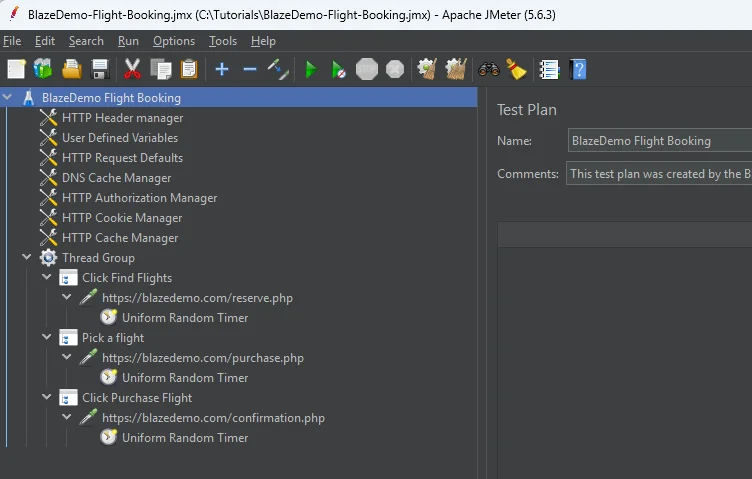
Launch JMeter by double clicking jmeter.bat in the bin folder. Once it’s open, go to File → Open and select the JMX file you exported from BlazeMeter.
You’ll see your recorded flow loaded as a test plan in the left panel. BlazeMeter organizes your recording into a Thread Group containing all the requests you captured.
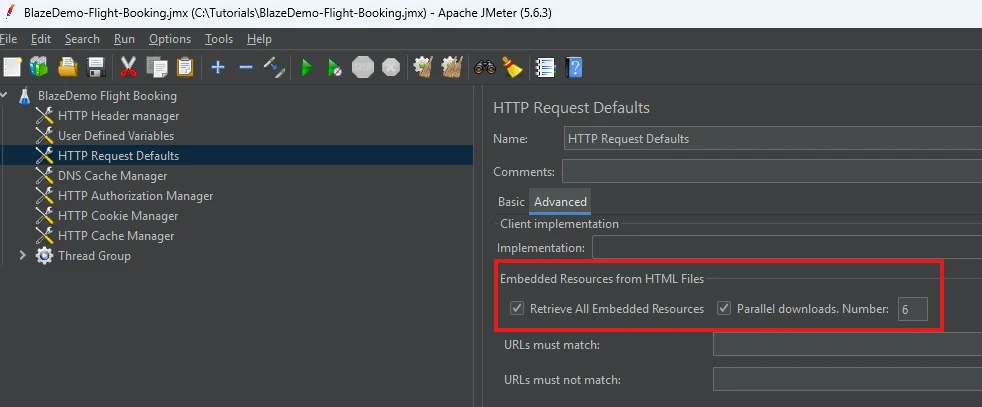
Step 2 — Remove Parallel Downloads
Before configuring anything else, look for the HTTP Request Defaults element, switch to the Advanced tab, and look for the Embedded Resources from HTML Files section. Uncheck both Retrieve All Embedded Resources and Parallel downloads settings that controls concurrent downloads. We’re testing backend API performance, not browser rendering — parallel downloads add noise and don’t reflect what we’re measuring.
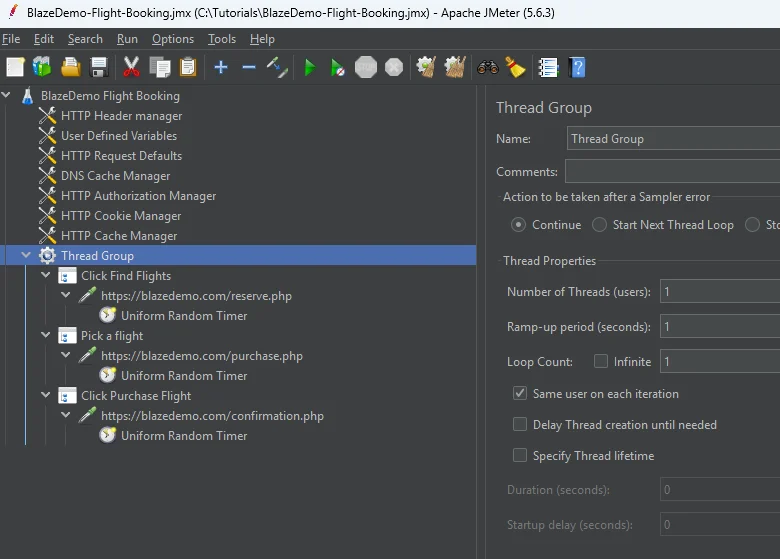
Step 3 — Configure the Thread Group
The Thread Group is where you control how many simulated users run your test and how they behave. Right click the Thread Group to open its settings.
The three settings that matter:
- Number of Threads (Users) — how many simultaneous users to simulate. Sanity check your script first with 1 user and then at least 2 to check the script can handle multiple users cleanly.
- Ramp-Up Period (seconds) — how long JMeter takes to spin up all your threads. A ramp-up of 10 seconds for 10 users means JMeter adds roughly 1 new user per second until all 10 are running. This mimics realistic traffic growth rather than slamming the server all at once.
- Loop Count — how many times each user runs through the flow. Set this to 1 for now. This means once the user completes the flow, they will exit rather than go through the flow again.
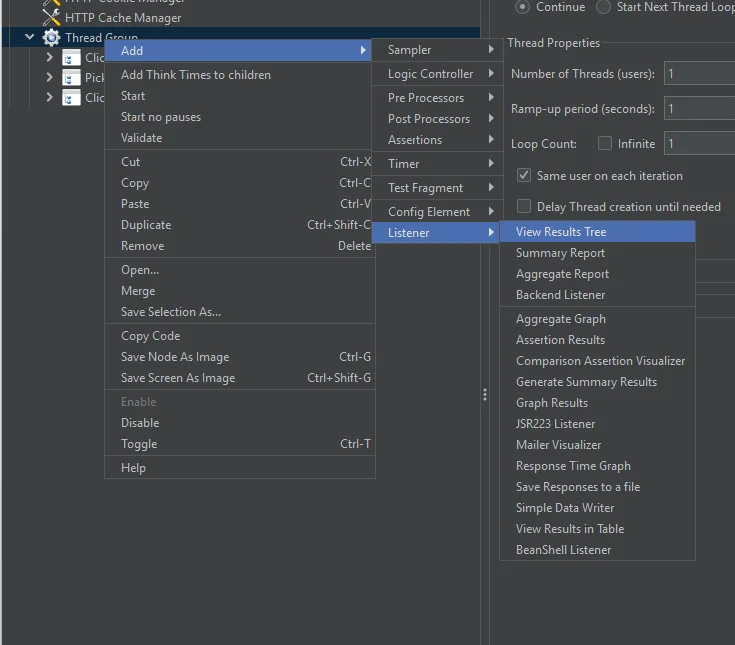
Step 4 — Add a Listener to See Results
JMeter doesn’t show you results unless you add a Listener. Right click your Thread Group → Add → Listener and add the following:
- View Results Tree — shows you each request and whether it passed or failed. Use this to debug your script during low user runs. Disable it for high load tests — it’s resource intensive.
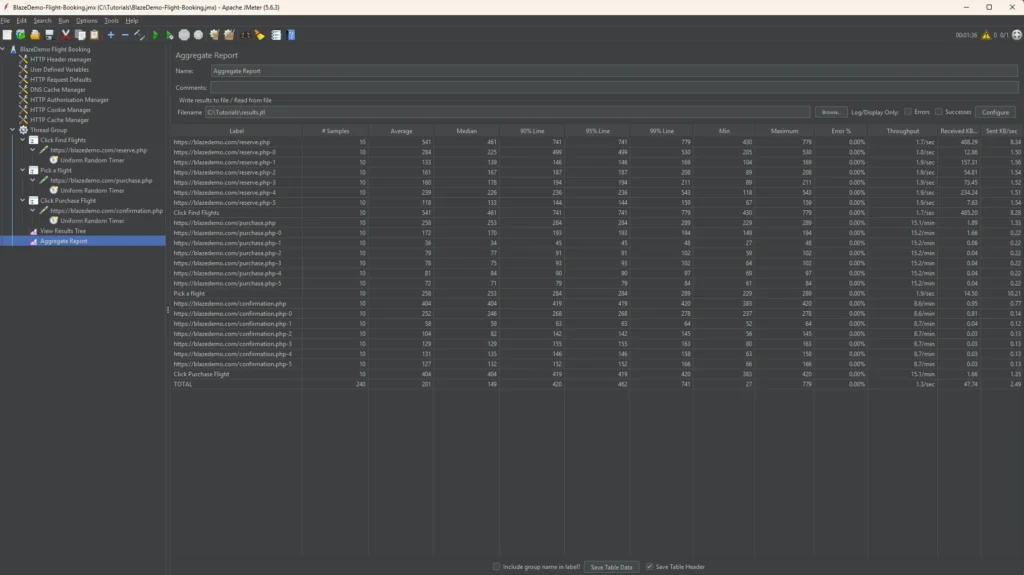
- Aggregate Report — gives you the percentiles (90th, 95th, 99th) which are more meaningful than the averages in Summary Report.
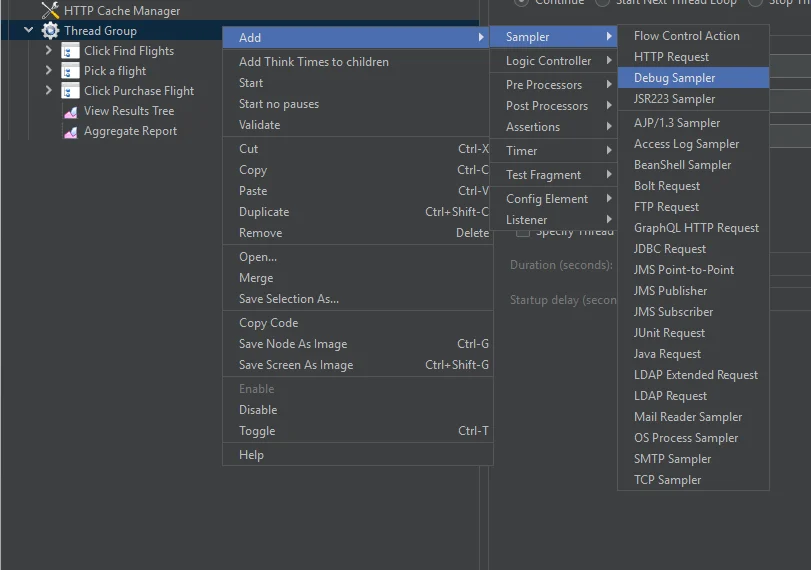
Step 5 — Add a Debug Sampler
Before running the test, add a Debug Sampler to verify that your variables and parameters are being passed correctly. Right click your Thread Group → Add → Sampler → Debug Sampler.
Pair it with View Results Tree so you can actually see the output. Once you’ve confirmed everything looks right you can leave these enabled — when running via the JMeter GUI you’re doing low user debugging runs anyway, so the resource overhead is fine. When you’re ready to run a real high load test you’ll switch to non-GUI mode via the terminal, which is where you disable or remove these. We’ll cover that in the next section.
Debugging and Running Your Load Test
You have your script configured. Before you unleash thousands of simulated users on the server, you need to make sure the script actually works. A broken script at high load just generates garbage results.
Step 1 — Run With 1 User First
Set your Thread Group to 1 user, 1 second ramp-up, 1 loop. Hit the green play button in JMeter GUI to run. Open View Results Tree and watch what comes back.
Green means the request succeeded. Red means it failed. Click on any request to see the full details — the request headers, the response code, and the response body. This is where you figure out what’s actually happening.
For the screenshot below, I purposely made a POST request to /purchases.php instead of /purchase.php to show you how a failed request would look.
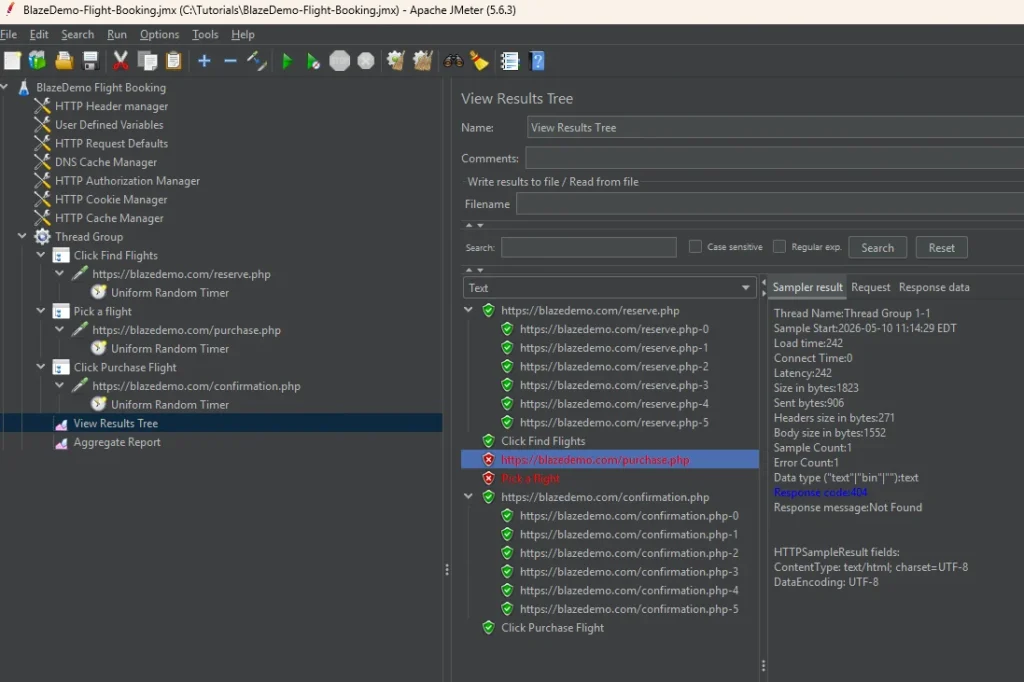
A few things you might see and what they mean:
- 401 Unauthorized — might be expected. Some endpoints require authentication and will return 401 if your session token wasn’t captured correctly during recording, or it may just be how the app behaves for certain calls. Know your app and expect these where appropriate.
- 400 Bad Request — usually means a request was set up incorrectly. Check the request parameters, headers, and body in View Results Tree. This is often a recording issue where a dynamic value like a session ID or token needs to be extracted and passed between requests.
Step 2 — Run With 2 Users
Once 1 user runs cleanly, bump it to 2 users. This is where multi-user issues show up — things like shared session tokens, race conditions, or endpoints that break when hit simultaneously. If 2 users run cleanly, you have a solid script.
A note on dynamic values
For blazedemo.com you won’t run into this, so feel free to skip ahead. But in real applications you’ll likely encounter dynamic values — session tokens, CSRF tokens, order IDs, anything the server generates on the fly and expects back in subsequent requests. BlazeMeter records the value from your single recording session, but that value won’t work for other users or repeat runs. This is the most common source of 400 errors in a freshly imported script.
I’ll cover how to handle dynamic values in a future post. For now, just know that if you’re seeing consistent 400 errors on a specific request in your own projects, that’s likely the culprit.
Step 3 — Disable Debug Tools and Set Real Load
Once your script runs cleanly at 2 users, you’re ready for the real test. Before you do:
- Disable View Results Tree and Debug Sampler — they consume resources and will affect your results at high load
- Update your Thread Group with your actual load — number of users, ramp-up period, and loop count. I’m using 10 users, 6 second ramp-up, and 1 loop for this example.
A word on infrastructure
Before you run the real load test, talk to your DevOps team. If your environment auto-scales — containers spinning up in response to traffic — you need to account for that. Load generated by JMeter can hit the server faster than the infrastructure scales up, which means your first wave of users slams an under-resourced environment and you get misleading results.
Two options: ask the team to pre-scale the environment before the test, or do a warm-up run first at lower load to trigger the scaling, then rerun the test knowing the infrastructure is ready. Either way, make sure the environment reflects what production will actually look like before you trust your numbers.
Step 4 — Run via Command Line
For real load tests, don’t use the JMeter GUI. The GUI itself consumes memory and CPU that should be going toward generating load. Switch to non-GUI mode via the terminal.
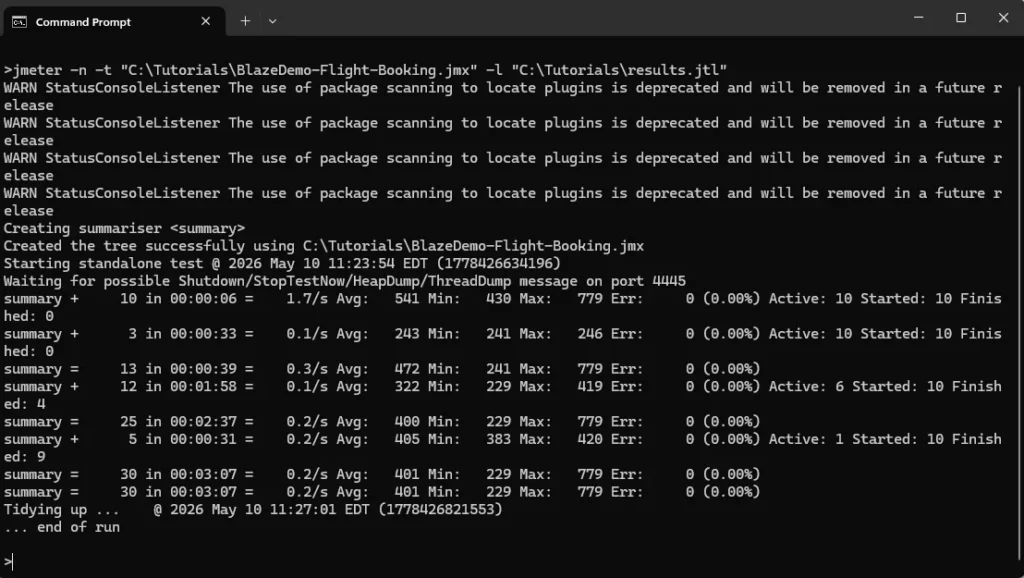
Navigate to your JMeter bin folder in Command Prompt and run:
jmeter -n -t your_test_plan.jmx -l results.jtl-n— non-GUI mode-t— path to your JMX file-l— path to save your results file
JMeter will run the test and log results to the .jtl file. Once the test finishes, open that file in JMeter GUI by loading it into your Aggregate Report listener to see your results.
While the test is running, open your browser and navigate through the site manually. Click around, add something to cart, go through the flow. You’ll feel firsthand how slow or fast the experience is under load. No chart tells you what it feels like to be a real user when the server is under pressure.
Reading and Interpreting Your Results
Your test finished. Now what?
Step 1 — Check for JMeter Errors First
Before you look at a single response time, load your results.jtl file into View Results Tree with the Errors checkbox selected. You’re looking for JMeter-level errors — BindExceptions, connection errors, anything that means JMeter couldn’t generate the load correctly. If these exist your results are unreliable. Fix the tool first, then rerun.
A BindException means your system ran out of available network connections and couldn’t generate the load correctly. If you see this, reduce your thread count or search for “JMeter BindException fix” for solutions specific to your operating system.
Step 2 — Look at Application Errors
Once you’re confident JMeter generated the load correctly, look for application-level errors next. Load your .jtl file into your Aggregate Report listener and check the error rate column to see which endpoints are failing. Cross reference with View Results Tree for the specific error codes.
Not all errors are bad — some are expected. A 401 on a specific endpoint might just be how the app behaves. What you’re looking for is the pattern. Are failures concentrated on one endpoint, or are they spreading across the flow? A failing endpoint early can cause cascading errors downstream — that’s a different problem than endpoints failing independently under load.
Pay attention to the error types:
- 502 Bad Gateway — an upstream service is overwhelmed or crashed under load
- 504 Gateway Timeout — the server is too slow to respond within the timeout window
Both signal infrastructure struggling under pressure. Bring them to your DevOps and engineering team.
Step 3 — Find Your Slowest Endpoints
Now look at response times. Don’t focus too much on the average or median — go straight to the 90th and 95th percentile columns.
Early on I made the mistake of looking at the average and median only. Both looked fine. But the application was breaking — thousands of learners couldn’t find their course or complete checkout. The app was timing out for a significant chunk of users and the average was hiding it completely. Even if the 95th percentile only represents the slowest 5% of your users, that’s still 1 in 20 people waiting 8 seconds. At scale, that’s lost revenue.
A rough baseline:
- Under 200ms — excellent
- 200ms–1s — acceptable
- 1s–3s — slow, worth investigating
- Over 3s — users will feel it
Sort by 95th percentile and identify your top 5 slowest endpoints. Those are where the conversation with your engineering team starts. On the ed-tech project we had no established baselines — nobody wanted to put hard numbers on it upfront. What we did have was obvious problems. Checkout and pages loading large course catalogs were taking well over 3 seconds under load. We sorted by the slowest, handed those to the engineers, and they went to work optimizing.
Step 4 — Correlate With Infrastructure Metrics
JMeter tells you what users experienced, and your infrastructure metrics can tell you why.
On the ed-tech project we had an AWS CloudWatch dashboard that showed us requests per second over time — which confirmed we were actually generating the load we intended. CPU and RAM metrics showed us when resources were hitting their limits. Slow endpoints caused both to spike. The DevOps team also prepared additional metrics — database performance, 400 and 500 error rates, container health — that helped the engineering team pinpoint exactly where the bottlenecks were.
If you’re working with a DevOps or engineering team, ask them to set up a dashboard before the test. Your dashboard will look different depending on what your team has configured — the specific metrics available will vary. The combination of JMeter results and infrastructure metrics tells a much more complete story than either one alone.
Step 5 — Ramp Up to Find Breaking Points
Once you’ve optimized the obvious bottlenecks, start pushing harder. Increase your thread count progressively — 100 users, 250, 500, 1000 — and observe where response times start climbing and error rates spike. That’s your breaking point.
This is technically stress testing rather than load testing. Load testing validates that your system handles expected traffic. Stress testing finds where it breaks. Both are useful — load testing before a launch, stress testing to understand your ceiling.
On the ed-tech project we ran various scenarios at increasing loads, the engineers investigated and optimized, and we kept pushing until the system held up at the traffic we expected for launch day. That’s the process.
Performance testing is just collecting information about how your software performs. Load testing is one type — specifically how it behaves when many users hit it at once. Same philosophy as everything else in software testing, just a different kind of information.
You now have a working workflow: record a realistic flow with BlazeMeter, configure and debug it in JMeter, run it from the command line, and interpret the results. That’s the same process I used on a real course platform launch. It works. If you don’t want to use the BlazeMeter recorder, you can manually create all those requests in JMeter — but like I said, it’s tedious.
A few things to keep in mind as you take this further:
Real applications are messier than blazedemo.com. You’ll run into dynamic values that need to be retrieved from the response body of a previous request. You’ll need scripts that are maintainable and can execute across environments like QA or Staging, so variable use is important. You’ll also need to set up test data and test accounts if you’re testing authenticated flows. I’ll cover all of that in a future post.
Like any testing or QA activity, load testing is a team sport. The results you collect are only as useful as the conversations they start. Engineers optimize. DevOps scales. You collect the information. That’s the job.